Recently, I've noticed a performance issue related to the Largest Contentful Paint (LCP) score on the homepage of my personal site: jonathanlau.io.
In this post, I'll be delving into the topic of LCP, conducting an analysis to uncover the reasons behind the LCP errors I'm experiencing on mobile devices.
Background
Every time your browser updates a pixel, it's referred to as a "paint" event. When this paint event involves content - for example, text or an image - it's known as a "Contentful Paint," or CP.
Therefore, the "Largest Contentful Paint", LCP, refers to the paint event that updates the largest amount of pixels compared to all other elements on the screen.
Essentially, LCP is the moment when the most significant piece of content is fully displayed on the screen.
Largest Contentful Paint (LCP)
Why LCP Matters
Largest contentful paint or (LCP) is one of the Core Web Vitals metrics that measure how long it takes for the largest content element to display on your screen. With recent updates, LCP is also included in Google’s Page Experience update which makes it even more important if you want to improve your website’s ranking and enhance the user experience on your website.
If the largest contentful paint element doesn’t load in time, visitors may not see anything on the web page until it fully loads up. (LCP) is always above the fold or at the top of the webpage.
Largest contentful paint elements may include images, text blocks, videos, animations, or elements with background images loaded through URL instead of CSS. In addition to this, block-level elements such as <h1>, <h2>, <ul>, and <table> on your site can be largest contentful paint elements.
Diagnosing the Issue
I used two tools to collect performance metrics for my site as defined by Core Web Vitals. During development, I used Lighthouse to spot potential areas for optimization. Once the site was ready for production, I switched to WebPageTest to see how the site performed in a live environment.
The largest contentful paint element can vary between mobile and desktop versions of a website. In my case, an issue with LCP is indicated on mobile while desktop LCP seems to pass Lighthouse audits, at least in my local environment.
In this case study, I'll concentrate on mobile audits, a common focus of most performance tools. In retrospect, I should've prioritized mobile performance during development due to its impact on accessibility and the prevalence of performance issues on less powerful devices. By improving mobile performance, I'll likely resolve any desktop performance issues as well.
LCP Score Interpretation
Google considers a website’s perceived load time of less than 2.5 seconds to be “good”. The table below provides a summary of the load time value ranges and the rating for each.
| LCP | Score |
|---|---|
| 0 - 2.5s | Good |
| 2.5 - 4s | Average |
| Over 4s | Slow |
Lighthouse Audits
These tests are conducted on a local production build, using Vite as the Javascript bundler for compilation with cache disabled and throttled network conditions set to Slow 3G.
Desktop Audit
Results for desktop will be ignored for this experiment.
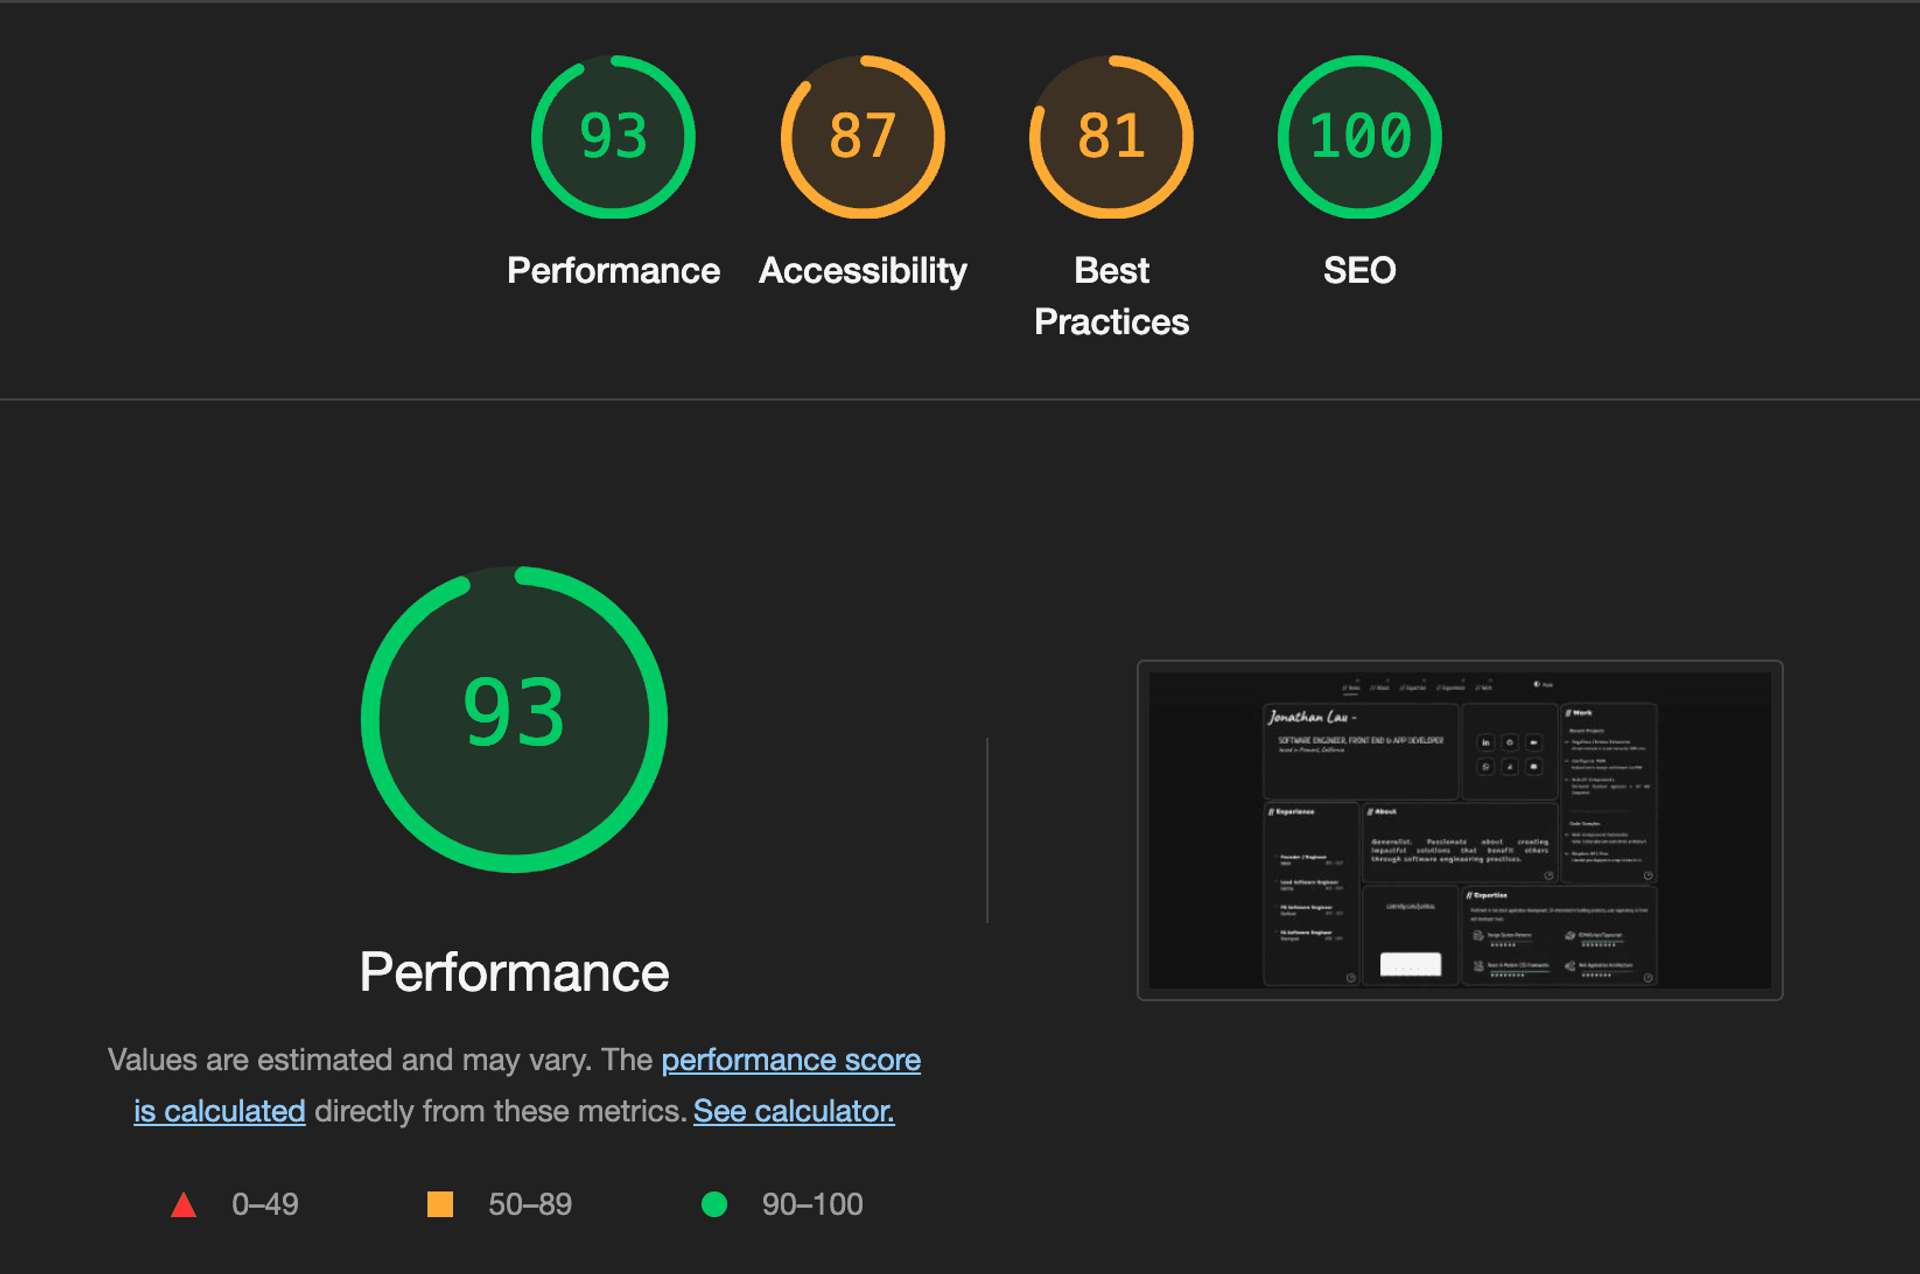
Mobile Audit
Yikes.
WebPageTest Audit
Despite varying timing measurements between my local Lighthouse audits and the WebPageTest audit, a comparison of the event summaries revealed a consistent issue with the LCP across both tests.
Inconsistent Lighthouse results can stem from fluctuating network conditions, variable server performance, client-side variability, dynamic content on the website, geographical test location, and differences between browsers.
Event Summary Analysis
In this section, I'll analyze the key performance metrics and events that were identified during our audit.
LCP Element
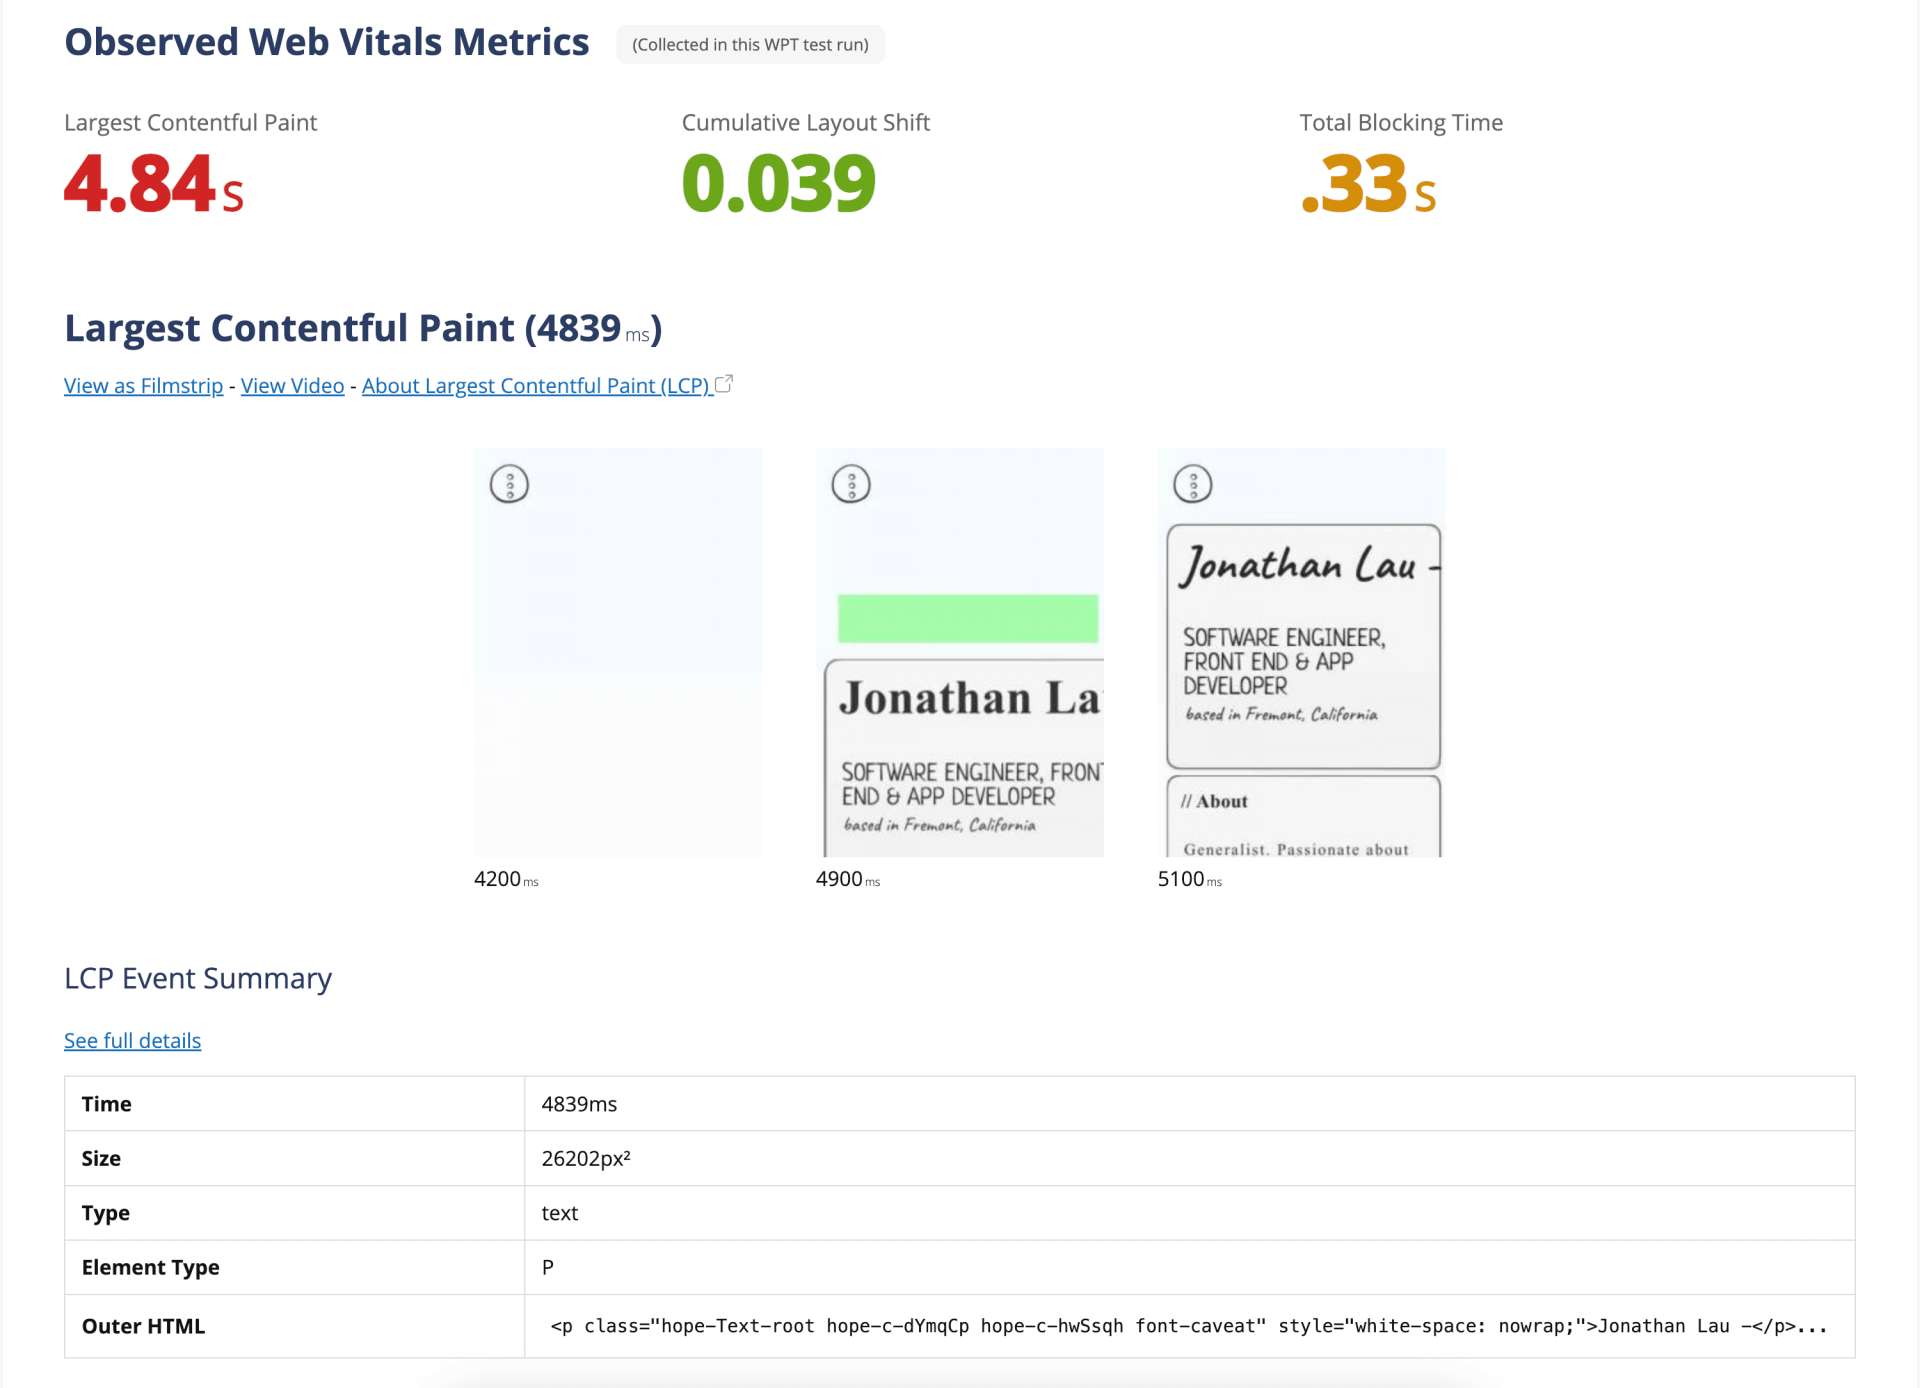
The LCP metric measures the time it takes for the largest content element in the viewport to become visible.
The HTML driving LCP is:<p class="hope-Text-root hope-c-dYmqCp hope-c-hwSsqh font-caveat" style="white-space: nowrap;">Jonathan Lau -</p>
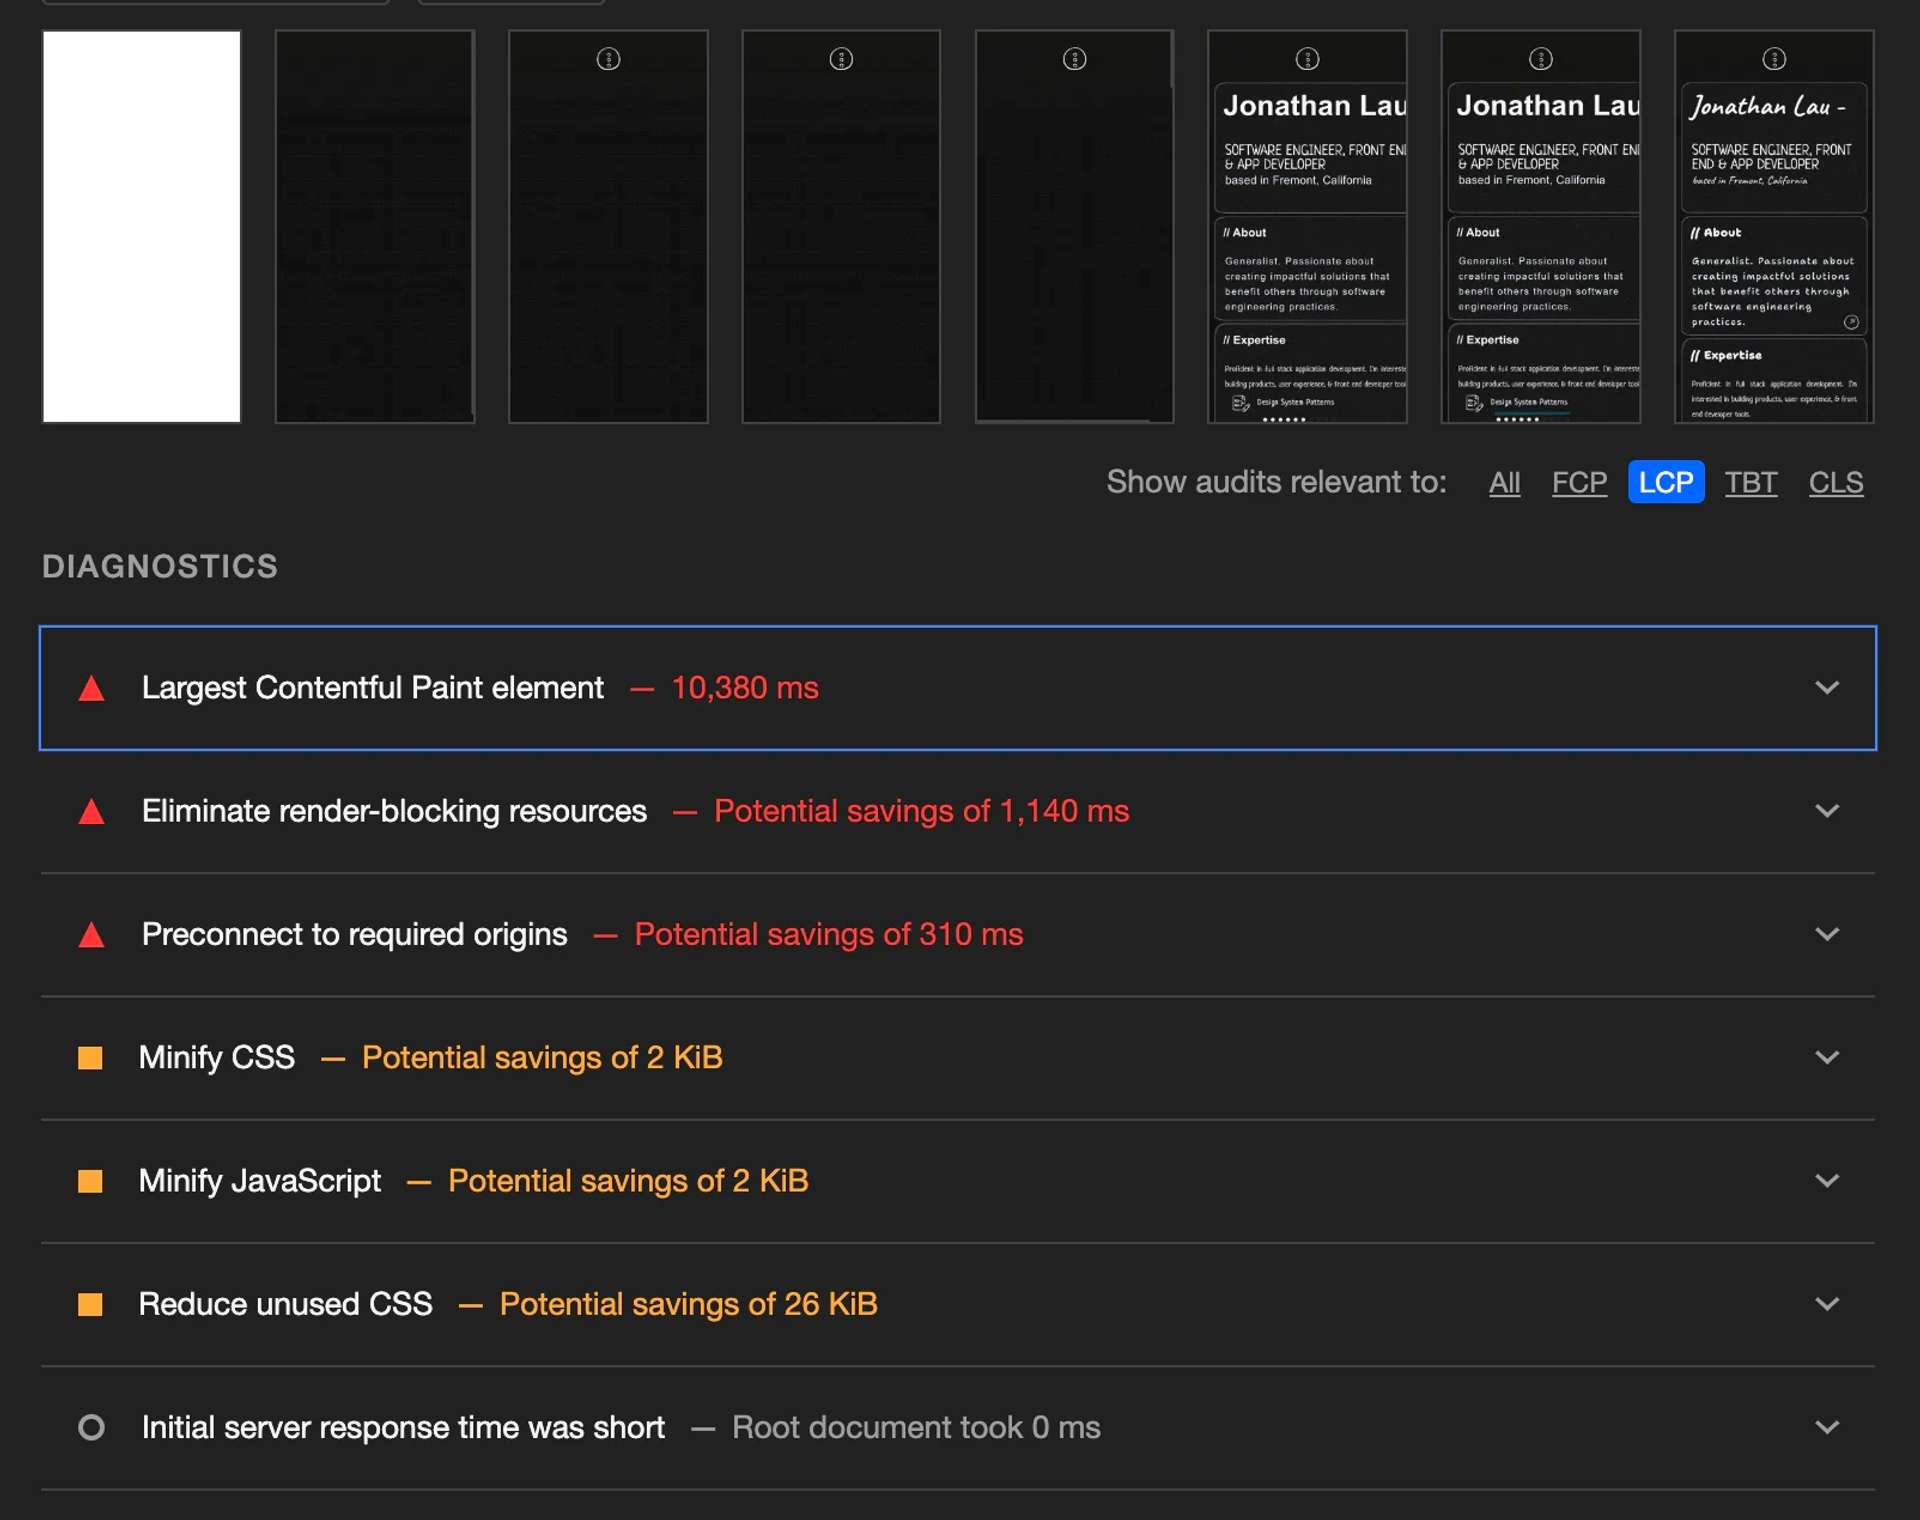
The LCP is recorded at 10,380 ms, which is significantly higher than the recommended maximum of 2.5 seconds. This suggests that the main content of the page is taking too long to render, which could lead to a perceived delay by the user.
Render-blocking Resources
Our audit suggests potential savings of around 1,140 ms by eliminating render-blocking resources. These are typically scripts or stylesheets that prevent the page from rendering until they have finished loading. We need to investigate these resources further and consider loading them asynchronously or deferring their loading.
Preconnect to Required Origins
By preconnecting to required origins, we could potentially save around 310 ms. Preconnect allows the browser to set up early connections before an HTTP request is actually sent to the server. This includes DNS lookups, TCP handshakes, and optional TLS negotiations.
| URL | Potential Savings |
|---|---|
| https://s2.svgbox.net | 310 ms |
| https://res.cloudinary.com | 310 ms |
| https://fonts.gstatic.com | 310 ms |
Unused CSS

The audit shows that 93% of our CSS is unused when the page loads. This suggests that a significant portion of our CSS isn't necessary for rendering the above-the-fold content. We should consider removing or deferring the loading of this unused CSS.
Fonts Loaded After Onload
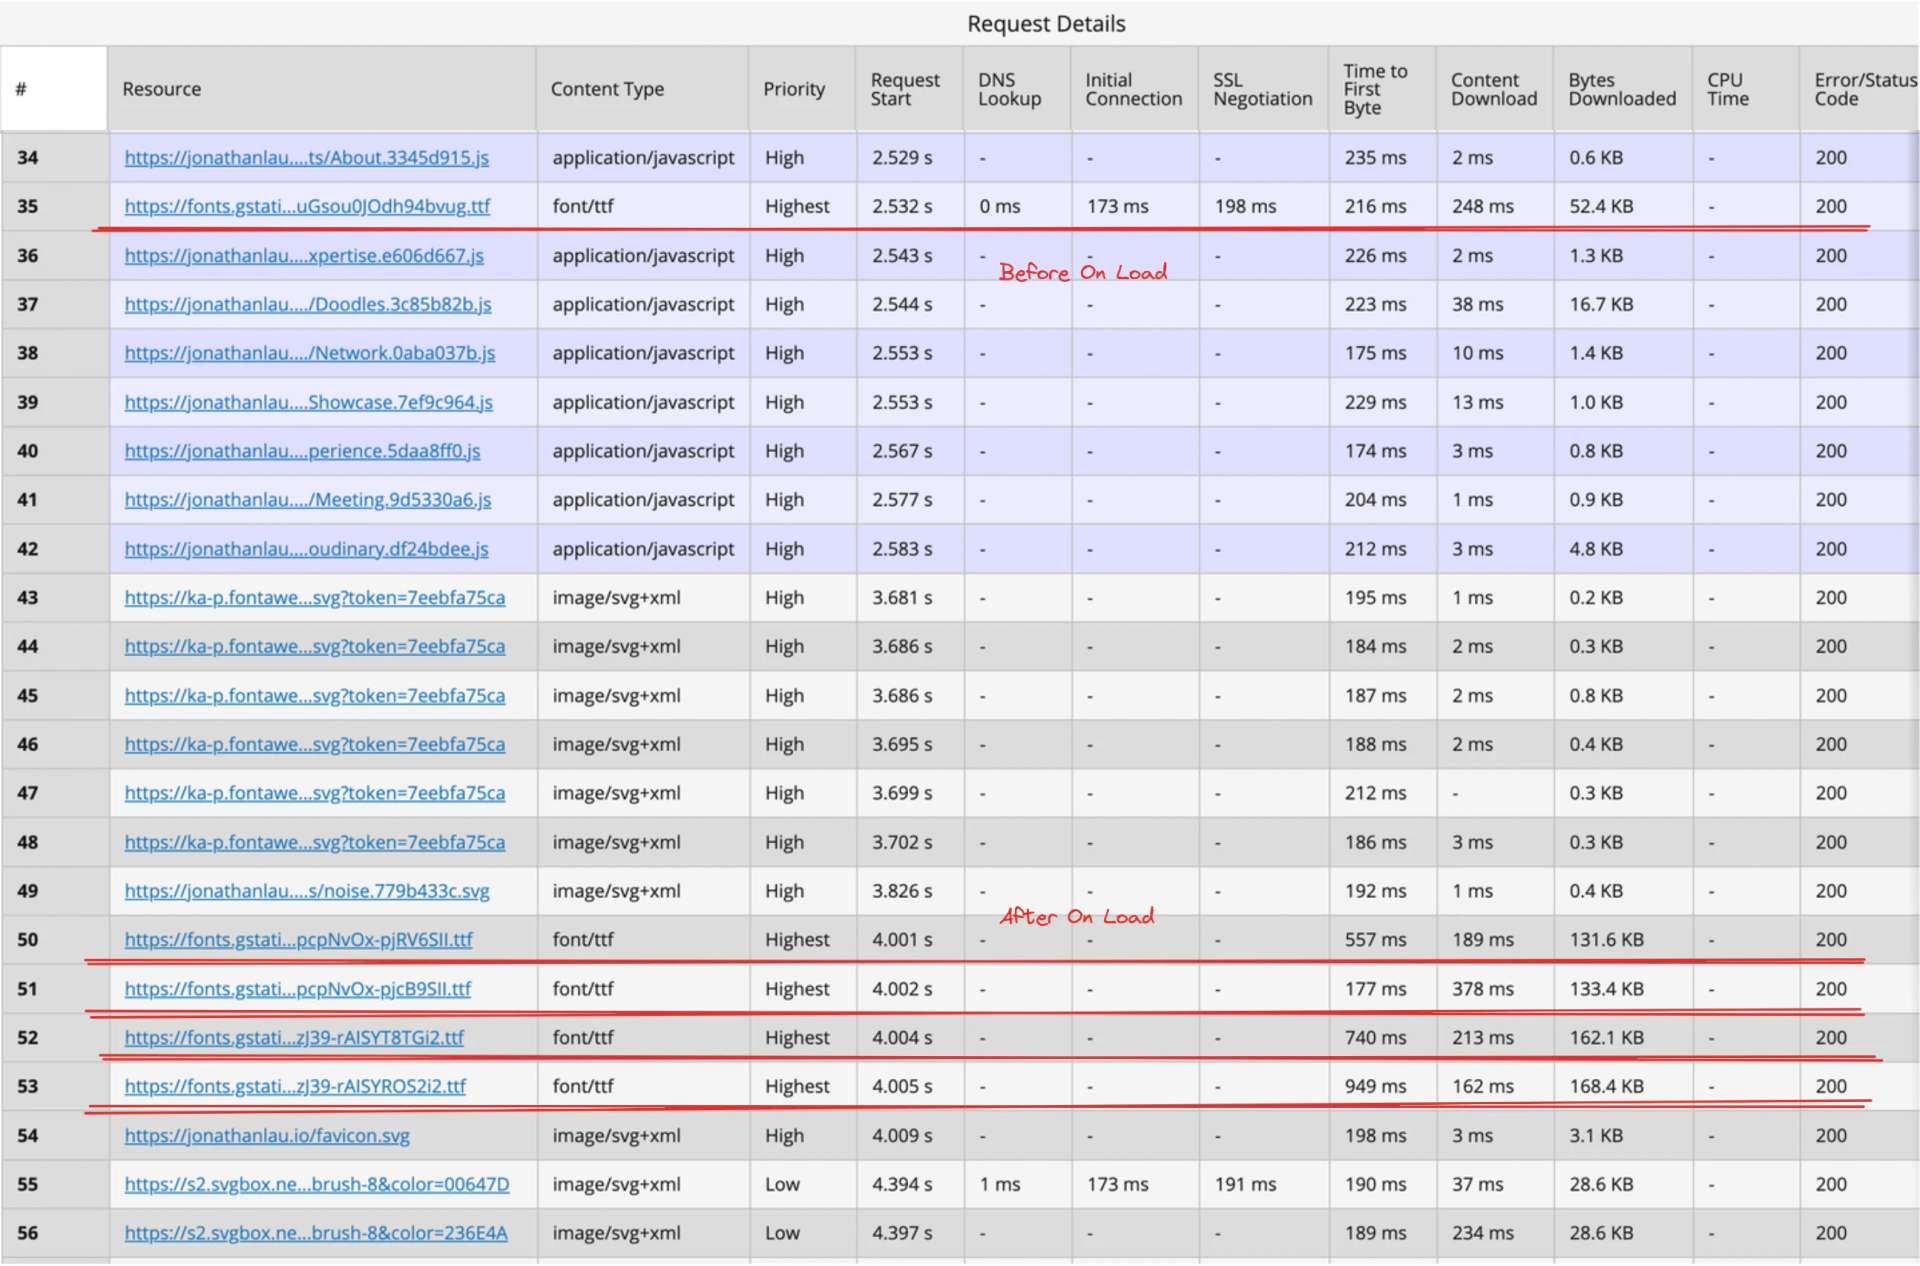
The fonts that our LCP element relies on are loaded after the window's load event. This means that the browser won't display the text in the LCP element until these font files are downloaded and ready, which could be delaying our LCP. We need to optimize our font loading strategy, possibly by preloading these fonts.
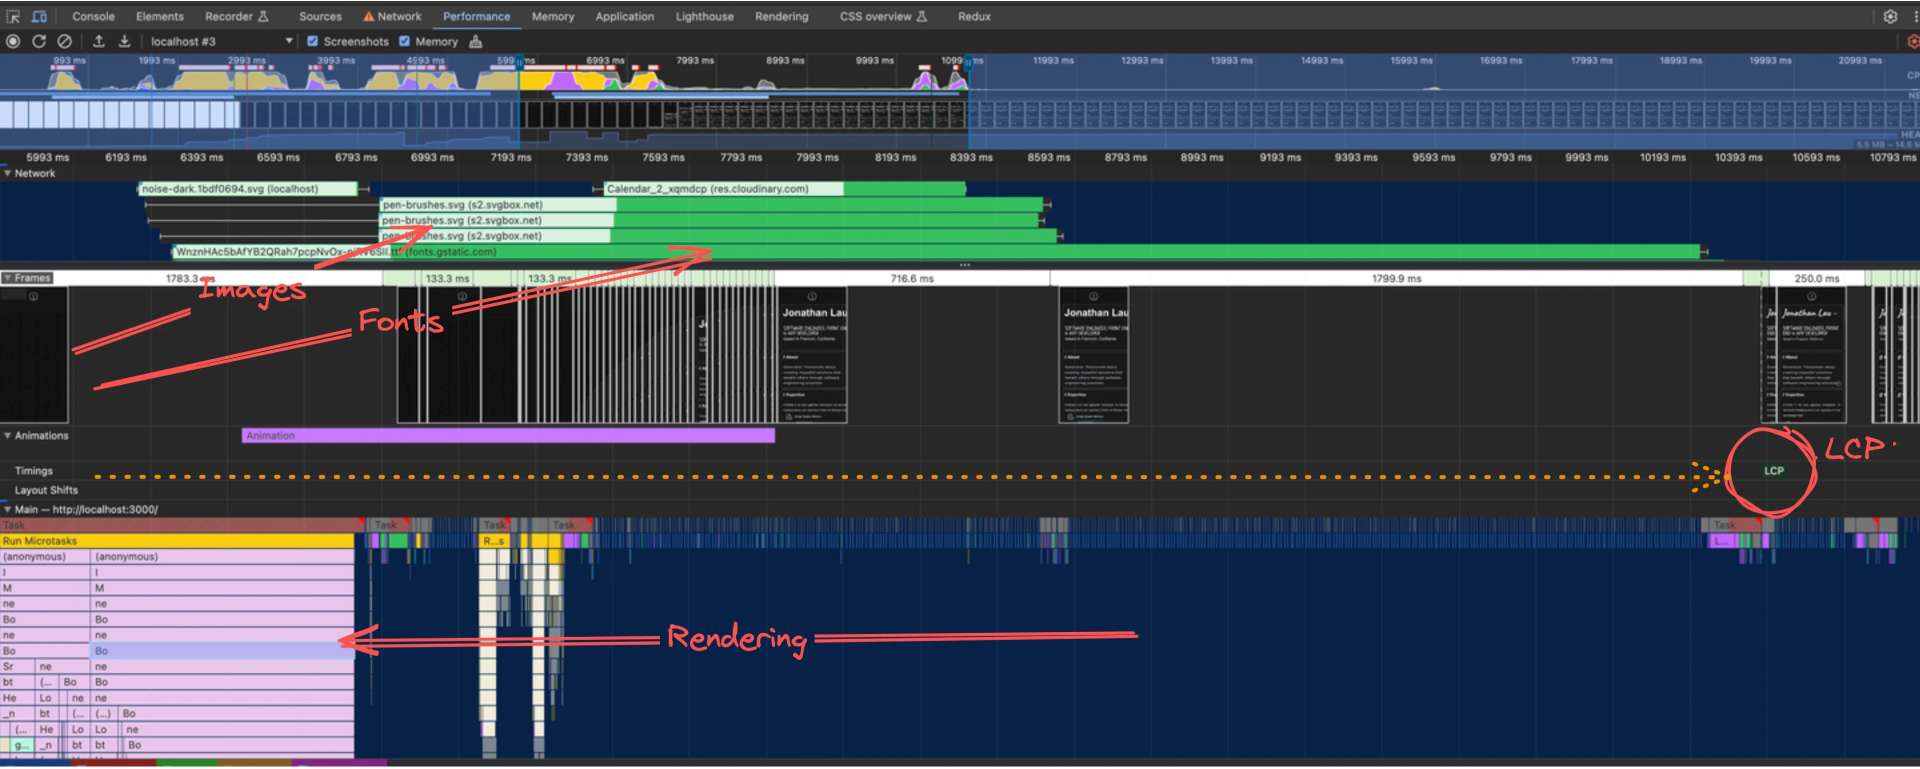
Performance Audits
The results from Lighthouse and WebPageTest performance audits are consistent and show significant amount of main thread activity before the load event. This suggests that there might be some JavaScript or style calculations blocking the main thread and delaying the load event.
Network
Waterfall Chart
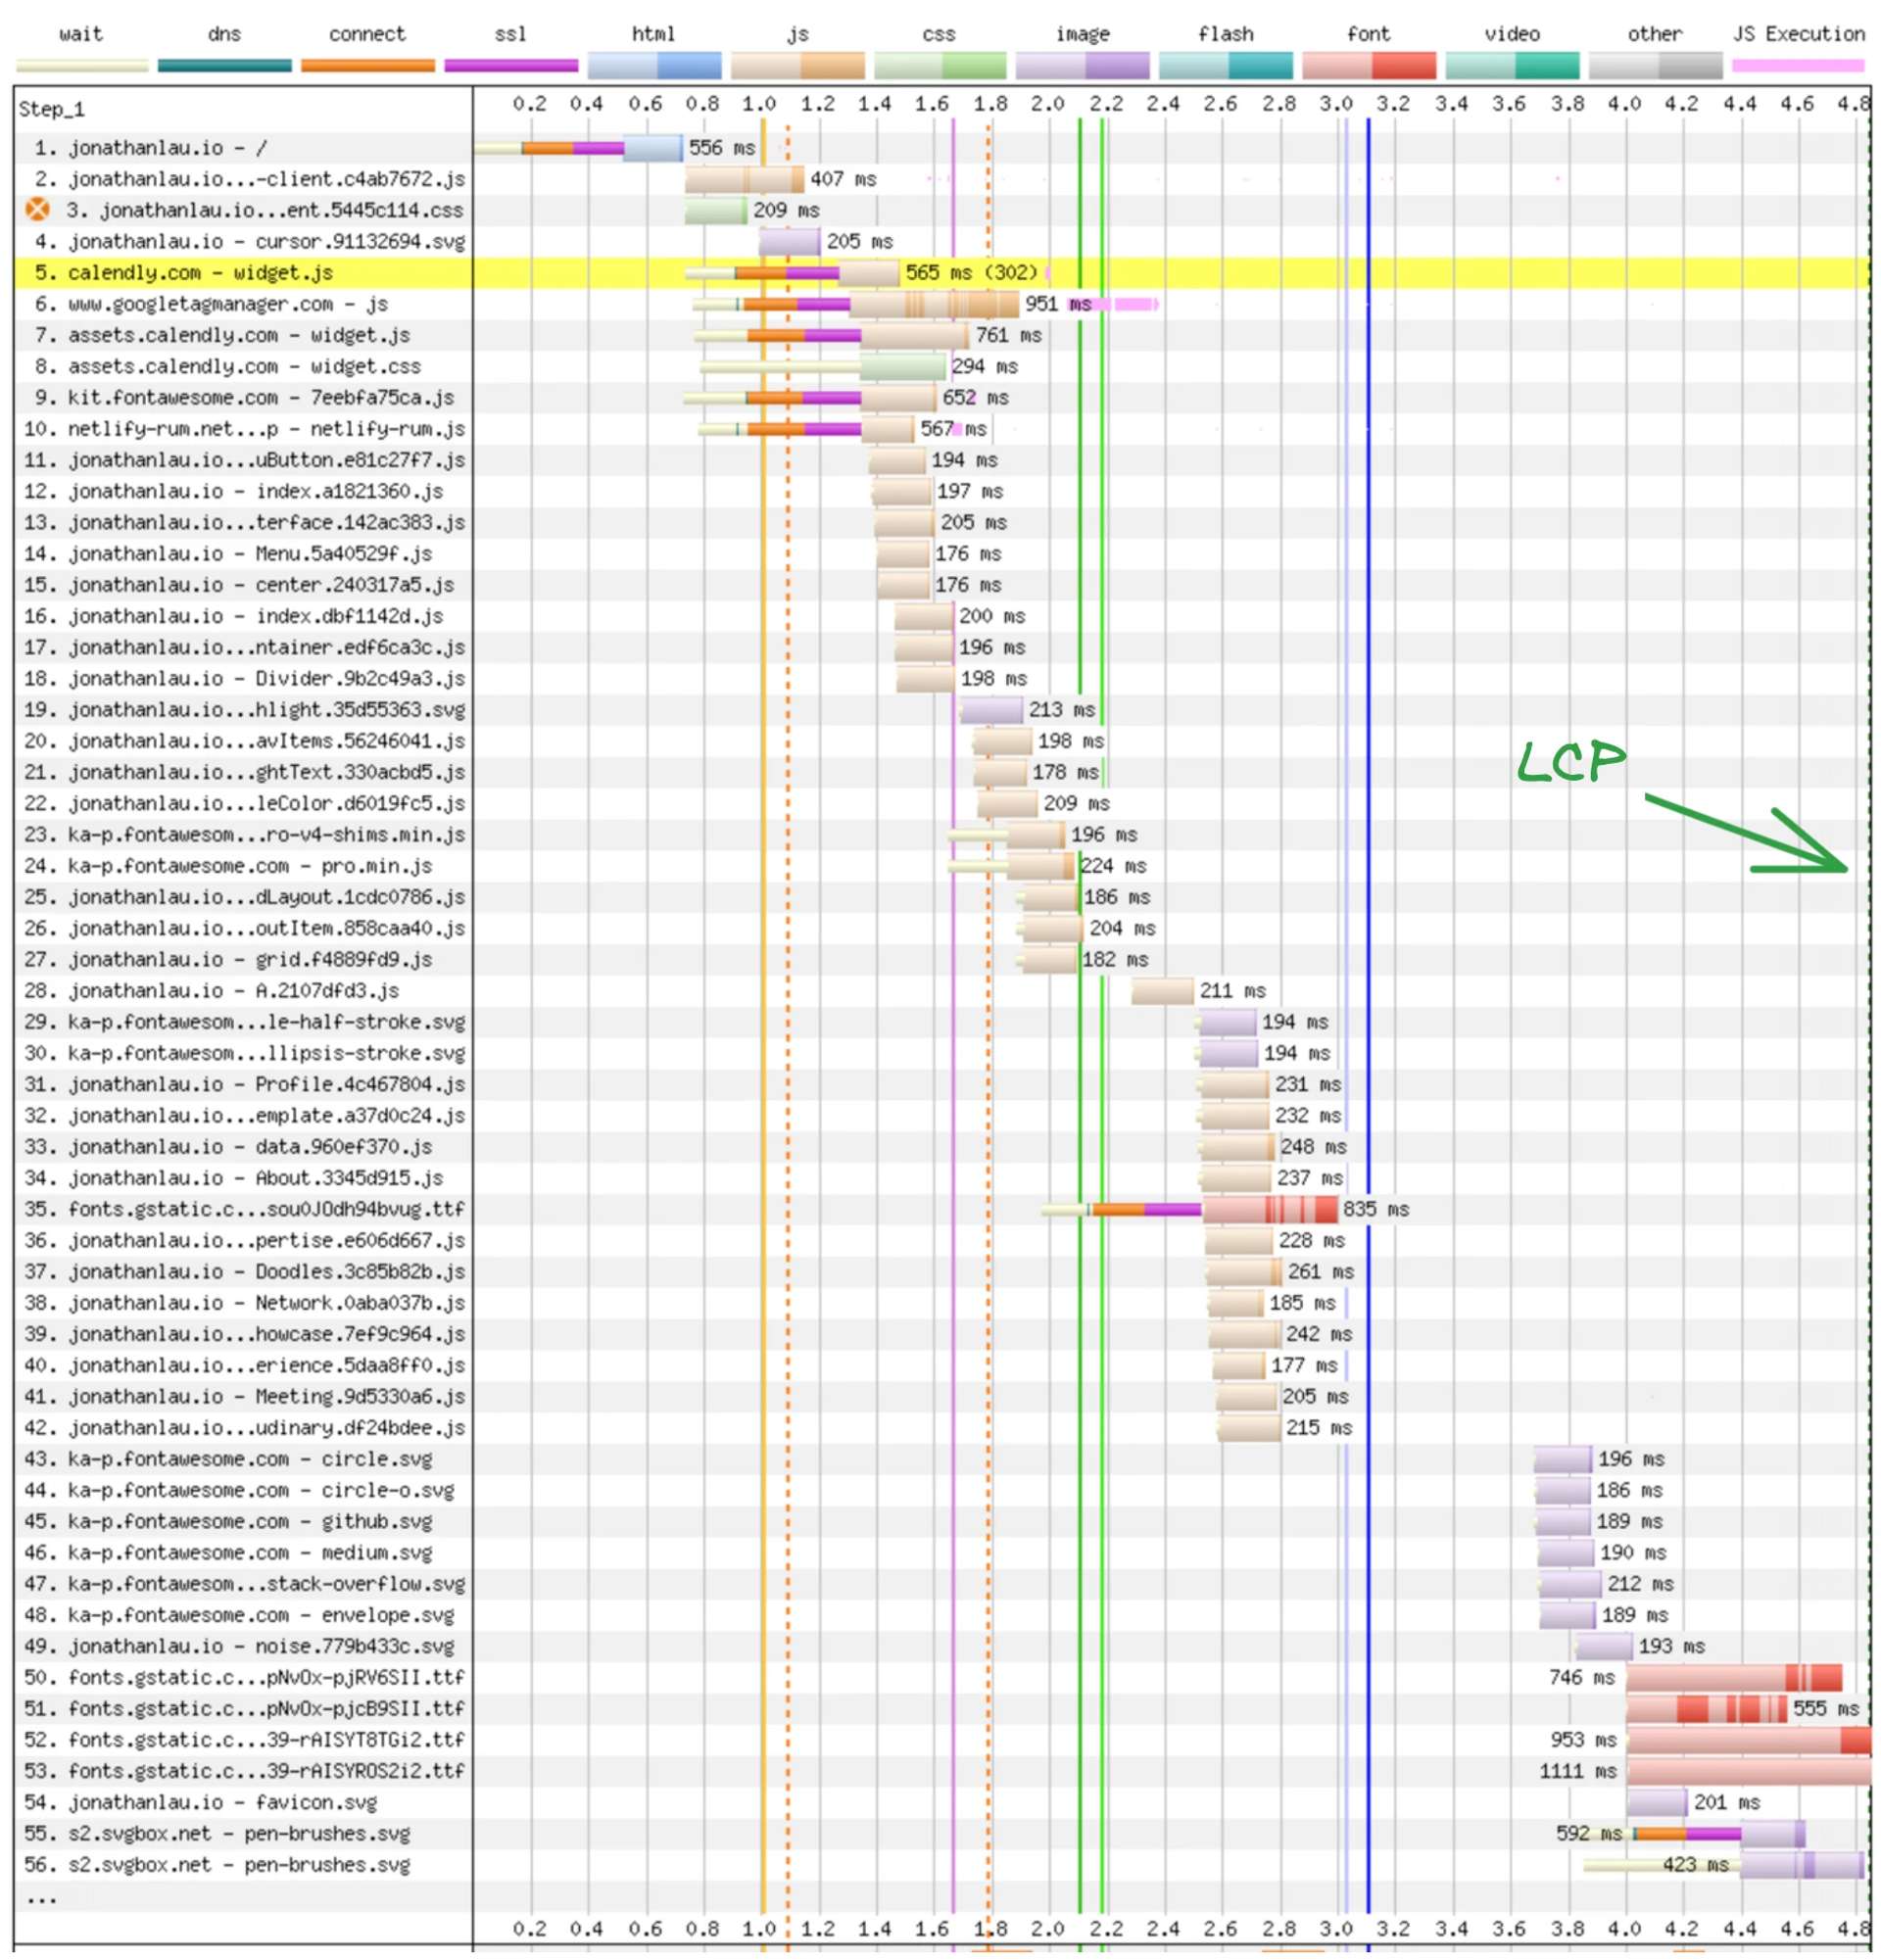
This observation aligns with our audit results, which suggested potential savings by eliminating render-blocking resources.
Next steps would be to identify these resources and optimize their loading strategy.